
Welcome to the ALAN Drug Development Dashboard
All information shown on the Drug Development Dashboard is sourced from ClinicalTrials.gov. While we aim to keep everything accurate and current, ALAN cannot be held responsible for any errors or omissions in the data displayed.
What is the Drug Development Dashboard?
In order to advocate effectively for better treatment, care, and healthcare access, it’s essential to understand what treatments are available and what’s being researched. While information about clinical trials exists publicly through ClinicalTrials.gov, it can be challenging to access, understand, and draw meaningful conclusions from. That’s why we created the ALAN Drug Development Dashboard.
This interactive tool gathers all relevant clinical trial data from ClinicalTrials.gov for acute leukemia and presents it in a clear, accessible way. Whether you’re a patient exploring treatment options, a caregiver supporting a loved one, a clinical professional, or a researcher tracking the field’s evolution, this dashboard is designed to help you find the insights you need.
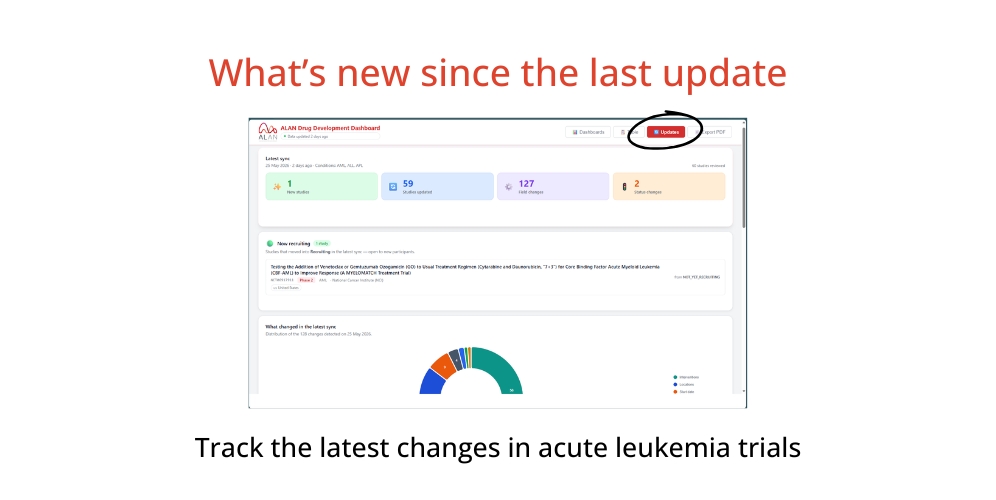
How can you use this data?
This dashboard helps you explore what’s being researched in the acute leukemia field and act on those insights. For example, patient representatives & advocates can take the insights and key data points from these graphics to support policy conversations or add to a campaign; and healthcare professionals can stay easily informed about the evolving research landscape.
While ClinicalTrials.gov offers a huge repository of raw information, finding what you need can often be time-consuming and challenging. This dashboard streamlines that process by curating acute leukemia data, creating clear visualizations, and presenting insights designed specifically to support advocacy work.
How to use the Dashboard
Using simple filters, you can customize your view of the data to answer specific questions or support your advocacy work:
- Study timeline: Filter by start dates and completion dates
- Geographic focus: Filter by country
- Patient population: Filter by age of enrolled participants
- Condition: Focus on AML, ALL, or APL
- Study status: Focus on only Active studies (i.e., Not yet recruiting, Recruiting, or Active not recruiting)
- Research stage: Filter by Phase I, II, III, or IV trials
Once you’ve found the information and graphs that you need, download them as PNG images or a PDF report for use in your own advocacy materials and presentations.

If you use or share data from this dashboard in your work, please credit us as: Acute Leukemia Advocates Network.
Note on Data Sourcing
All information displayed on the Drug Development Dashboard is sourced directly from ClinicalTrials.gov, and the data is refreshed once a month.
While we work to keep the data accurate and current, ALAN cannot be held responsible for any errors, omissions, or outdated information in the source data.
Questions?
Have questions or feedback about the dashboard? Reach out to us at info@acuteleuk.org.
Want to find a trial you may be eligible for?
If you’re looking for a clinical trial you may be eligible to join, we recommend using our personalized trial matching tool at ancora.ai finder, which can help match your specific situation to open studies.